


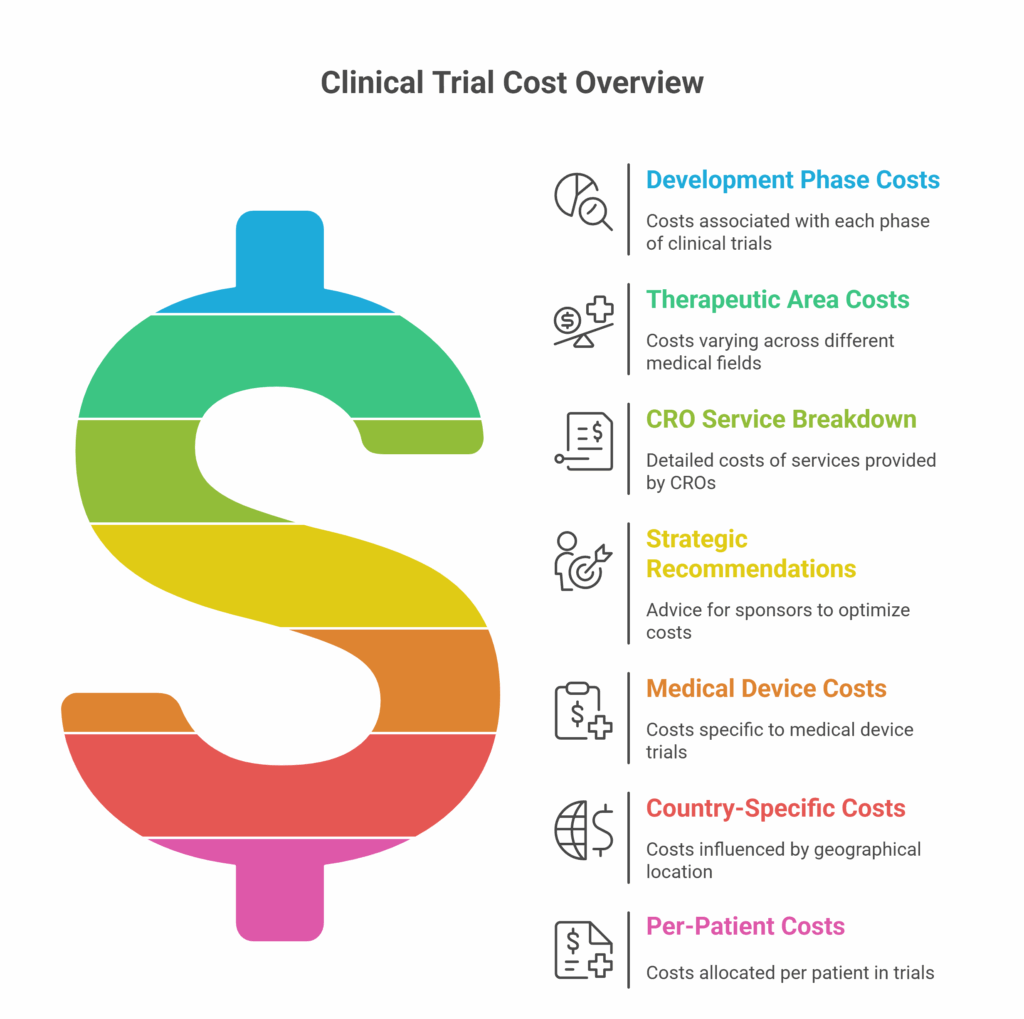
Phase-by-Phase Clinical Trial Costs provides a complete assessment of costs of clinical trials by phase and therapeutic area, with a focus on key cost components including per-patient costs, total costs, contract research organization pricing, and service-specific expenses.
Clinical trials represent one of the most resource-intensive stages in the lifecycle of a drug, biologic, or device. For sponsors, grasping the drug development cost breakdown by phase, as well as the cost structure of trials across therapeutic areas and CRO services, is essential to plan budgets, engage investors, and select outsourcing partners strategically. This detailed analysis consolidates public data, industry standards, and Clinical Research Organization (CRO) cost models to offer real-world insights for sponsors.
Clinical Trial Costs by Development Phase
Clinical trial costs increase with each progressive phase of development, with Phase III trials being the most expensive in absolute terms. However, Phase I/II trials often incur the highest per-patient costs due to intensive monitoring and smaller cohort sizes, which makes grasping the cost of phase 1 clinical trials paramount for effective budgeting and resource planning in early-stage drug development. Sponsors must also carefully consider the clinical trial per-patient cost and other early phase trial expenses to ensure accurate financial forecasting and smooth trial execution.
Table 1: Average Clinical Trial Costs by Phase
The average costs of clinical trials by phase can vary considerably based on factors such as therapeutic area, trial complexity, and geographical location. Below is a general overview of the estimated costs associated with each phase of clinical trials:
|
Trial Phase |
Avg. Total Cost (USD) |
Avg. Enrollment |
Avg. Cost per Patient (USD) |
|
Phase I |
$5.26 million |
39 |
$136,783 |
|
Phase I/II |
$10.79 million |
71 |
$155,340 |
|
Phase II |
$18.49 million |
143 |
$129,777 |
|
Phase II/III |
$42.10 million |
300 |
$140,344 |
|
Phase III |
$52.84 million |
479 |
$113,030 |
Key Points:
- Phase III trials involve large populations, long durations, and multicenter logistics.
- Cost per patient generally decreases with higher enrollment.
- Phase I trials focus on safety and pharmacokinetics, with high complexity per subject.
Clinical Trial Costs by Therapeutic Area
Therapeutic area substantially influences cost, with oncology and neurology ranking among the most expensive. Factors include recruitment difficulty, complex endpoints, longer timelines, and advanced diagnostics. Specifically, the oncology clinical trial cost per patient tends to be higher due to intensive monitoring, specialized treatments, and the need for advanced diagnostic assessments.
Table 2: Average Per-Patient Costs by Indication and Phase
|
Therapeutic Area |
Phase I ($) |
Phase II ($) |
Phase III ($) |
|
Oncology |
152,000 |
130,500 |
124,800 |
|
Neurology |
158,000 |
139,200 |
122,105 |
|
Cardiovascular |
135,000 |
127,000 |
121,000 |
|
Infectious Diseases |
122,000 |
119,500 |
111,100 |
|
Rheumatoid Arthritis |
145,300 |
128,000 |
121,383 |
|
Endocrine (e.g. T2D) |
131,000 |
124,500 |
119,241 |
|
Respiratory |
127,800 |
121,200 |
116,940 |
|
Dermatology |
110,000 |
104,000 |
99,800 |
|
Psychiatry |
139,000 |
125,700 |
118,000 |
Key Points:
- Oncology trials are most expensive due to biomarker testing, imaging, and long survival follow-ups.
- Infectious disease trials are more affordable due to high prevalence and shorter timelines.
How do costs vary by therapeutic area?
Clinical trial costs vary considerably by therapeutic area due to factors such as disease complexity, patient population, and regulatory requirements. Oncology trials are among the most expensive, with Phase III studies often exceeding $40 million, while dermatology, endocrinology, and gastroenterology trials typically cost much less. Other high-cost areas include cardiovascular, hematology, and anti-infective studies, which require specialized procedures, longer timelines, and intensive monitoring. Grasping clinical trial cost by therapeutic area is paramount for sponsors to plan budgets adeptly and optimize resource allocation across phases.
Detailed CRO Service Cost Breakdown
Contract Research Organizations (CROs) handle up to 65% of a trial’s scope, making it important to grasp the cost structure of their offerings. Evaluating CRO services pricing provides sponsors with better insight for budgeting, negotiation, and managing the overall clinical trials cost breakdown. Among different stages, phase II clinical trial services are particularly resource-intensive due to complex protocols and larger patient groups, often driving higher expenses. By reviewing costs at this stage, sponsors can optimize resource allocation, anticipate financial challenges, and achieve smoother trial execution.
Table 3: CRO Services and Typical Cost Allocation
|
CRO Service Component |
% of CRO Budget |
Notes & Examples |
|
Clinical Procedures |
15–22% |
Labs, imaging, biopsies, ECGs |
|
Site Monitoring |
9–14% |
On-site visits, data verification |
|
Project Management |
8–12% |
Coordination, reporting, oversight |
|
Data Management |
5–10% |
CRF setup, query resolution, database lock |
|
Biostatistics |
2–5% |
Analysis plan, interim/final analysis |
|
Regulatory Affairs |
5–8% |
IND/CTA submissions, IRB communication |
|
Patient Recruitment |
2–5% |
Outreach campaigns, patient databases |
|
Medical Monitoring |
3–6% |
AE/SAE review, medical oversight |
|
Quality Assurance (QA) |
3–5% |
GCP audits, compliance verification |
|
Legal, Contracts, Insurance |
10–15% |
Site contracts, trial insurance |
Key Points:
- Project management, site monitoring, and procedures make up the bulk of CRO costs.
- High recruitment costs occur in rare diseases and oncology.
- CROs charge a margin of 15–25% on top of direct costs, which should be negotiated.
Strategic Recommendations for Sponsors
- Plan Phase-by-Phase Budgets: Use benchmarks for cost and enrollment by indication.
- Negotiate CRO Proposals: Request detailed line-item budgets and compare across vendors.
- Optimize Protocol Design: Streamline assessments to reduce burden and procedural costs.
- Use Technology for Cost Savings: Leverage eConsent, remote monitoring, and digital data capture.
- Benchmark Against Historical Data: Utilize per-patient costs across phases and indications.
Standard costs and fees for sponsored clinical trials
Standard costs and fees for sponsored clinical trials depend on the trial phase, therapeutic area, patient population, and study complexity. Key cost components include site management, patient recruitment, laboratory tests, imaging, monitoring, d ata management, and regulatory compliance. Understanding these costs, including clinical trial costs by phase, helps sponsors plan budgets effectively, optimize resources, and ensure timely study completion.
Approximate Costs and Fees by Clinical Trial Phase
|
Phase |
Approximate Total Cost |
Per-Patient Cost |
Key Cost Drivers |
|
Phase I |
$1–$5 million |
$10,000–$50,000 |
Intensive monitoring, safety assessments, small cohorts |
|
Phase II |
$7–$20 million |
$15,000–$25,000 |
Dose optimization, efficacy evaluation, moderate cohort size |
|
Phase III |
$20–$100 million+ |
$20,000–$40,000 |
Large patient population, longer timelines, complex endpoints |
|
Phase IV / Post-Marketing |
$5–$15 million |
$10,000–$20,000 |
Long-term follow-up, safety monitoring, real-world data collection |
Factors such as geographic location, specialized procedures, and CRO fees can influence these costs. Sponsors who carefully evaluate standard costs and fees for sponsored clinical trials can better allocate resources, reduce financial risk, and improve the efficiency of their clinical research programs.
Strategic Approaches to Clinical Trial Cost Management
Strong clinical trial cost management is indispensable for sponsors and CROs to optimize budgets, reduce financial risks, and ensure timely study completion. By carefully monitoring expenses related to patient recruitment, site management, data collection, and regulatory compliance, organizations can allocate resources more strategically. A structured approach to managing clinical trial management cost not only minimizes unnecessary expenditures but also improves forecasting accuracy, enabling better decision-making throughout the clinical trial lifecycle.
Clinical Trials Costs By Phase 1 to 3 CRO Services
Awareness of the costs of Phase 1 to Phase 3 clinical trials is paramount for effective budgeting and smooth study execution. A Phase 1 CRO typically manages early-stage trials focused on safety, tolerability, and dose optimization, with costs generally ranging from $1–$4 million, depending on patient numbers and complexity. A clinical trial Phase 1 CRO ensures proper monitoring, regulatory compliance, and high-quality data collection. As studies advance, a clinical trial Phase 2 CRO handles larger patient populations and efficacy evaluations, with average costs between $5–$15 million, including site management, laboratory tests, and interim analyses. For pivotal trials, a clinical trial Phase 3 CRO manages large-scale multi-center studies, often costing $20–$50 million or more, covering extensive patient recruitment, data management, and regulatory reporting. Choosing the right CRO for each phase helps optimize timelines, control costs, and ensure reliable results across all stages of development. By being aware of Phase-by-Phase Clinical Trial Costs and CRO services, sponsors can plan strategically, control expenses, and maximize efficiency across Phase 1 to 3 trials while ensuring reliable outcomes.
Clinical Trial Cost Calculation
Accurately estimating expenses is a crucial step in any clinical study. Clinical trial cost calculation involves assessing factors such as patient recruitment, site management, regulatory submissions, data management, and monitoring. A clinical trial cost calculator can simplify this process, providing sponsors with a clear overview of projected budgets, including clinical trial recruitment cost per patient, and helping optimize resource allocation for successful trial execution. Using a clinical trials budget template further enhances this process by providing a structured framework to organize and track all anticipated costs, ensuring no critical expense is overlooked. These insights also help identify high-cost areas, forecast financial risks, and support informed decision-making, ensuring better planning for multi-phase trials, understanding clinical trial costs by phase, and accelerating overall drug development timelines.
Phase-by-Phase Clinical Trial Costs Insights for Medical Devices
Managing expenses in medical device studies requires accurate tools and data. Clinical trial cost software helps sponsors and CROs estimate budgets efficiently, track spending, and optimize resource allocation. Knowing the medical device clinical trial cost per patient is important for forecasting overall expenses, while analyzing the average cost of clinical trials for medical devices provides reference points for planning and decision-making, ensuring trials remain feasible and financially sustainable.
These insights also allow sponsors to identify high-cost drivers such as recruitment, monitoring, and regulatory compliance. Using cost analysis early in trial design can improve resource allocation and reduce unexpected financial risks, making the development process more predictable and efficient.
Sample Costing Table for Medical Device Clinical Trials
|
Cost Component |
Estimated Range (USD) per Patient |
Notes |
|
Site Initiation & Setup |
$5,000 – $15,000 |
Includes training, equipment setup, and site visits |
|
Patient Recruitment |
$500 – $3,000 |
Depends on device type and patient availability |
|
Clinical Monitoring |
$1,000 – $4,000 |
On-site and remote monitoring costs |
|
Regulatory & Compliance Fees |
$2,000 – $10,000 |
IRB/ethics review, reporting, and documentation |
|
Data Management & Analysis |
$1,500 – $5,000 |
Includes database setup, validation, and analysis |
|
Device Costs & Shipping |
$500 – $2,500 |
Manufacturing, quality control, and distribution |
|
Miscellaneous |
$500 – $1,500 |
Insurance, travel, and contingency costs |
Total Estimated Cost per Patient: $11,000 – $41,000 (varies by device complexity and study design)
Clinical Trial Cost by Country
When planning a global study, assessing clinical trial cost by country is essential, as costs can vary considerably depending on regulatory requirements, site infrastructure, and patient recruitment challenges. Evaluating phase-by-phase clinical trial costs also helps sponsors anticipate expenses at each stage of development and allocate resources more effectively. For instance, clinical trial cost in India is often lower compared to the US or Europe due to lower operational expenses and faster patient enrollment, making India an attractive destination for sponsors seeking cost-efficient yet high-quality trials. These cost differences can significantly influence budgeting and overall trial strategy. Additionally, sponsors must consider factors like local CRO expertise, logistics, and site management efficiency, which can further impact the total study expenditure. Careful planning and country-specific analysis help optimize both timelines and costs while maintaining compliance and data quality.
Average Clinical Trial Cost by Country (per patient basis)
|
Country |
Phase 1 (USD) |
Phase 2 (USD) |
Phase 3 (USD) |
Notes |
|
India |
$3,000–$5,000 |
$7,000–$12,000 |
$15,000–$25,000 |
Lower operational costs, faster patient recruitment |
|
USA |
$15,000–$25,000 |
$25,000–$50,000 |
$50,000–$100,000 |
Higher regulatory and operational costs, complex logistics |
|
Europe |
$12,000–$20,000 |
$20,000–$40,000 |
$40,000–$80,000 |
Costs vary by country; strong regulatory requirements |
Examination of Clinical Trial Costs and Barriers for Drug Development
Clinical trial costs and barriers for drug development represent significant challenges for pharmaceutical companies and research organizations. High financial investment is required at every stage of the drug development process, from early preclinical studies to late-phase clinical trials. Phase-by-Phase Clinical Trial Costs often arise from patient recruitment difficulties, complex protocol requirements, regulatory compliance, and advanced monitoring systems.
Recruitment delays can extend study timelines and increase overall expenses, while stringent regulatory standards add layers of administrative and operational burdens. Additionally, clinical trial costs and barriers for drug development include site management, data collection, and quality assurance measures, which are essential to maintain trial integrity but increase expenditures. Geographic variations also play a role, as costs can differ significantly between countries due to differences in labor, infrastructure, and regulatory frameworks.
Overall, clinical trial costs and barriers for drug development directly impact the speed of innovation and the ability to bring new therapies to market efficiently, highlighting the need for careful planning and resource allocation throughout the clinical development process.
Clinical Trials Budget Template
Planning and managing costs is a critical step in the successful execution of clinical trials. A clinical trials budget template helps sponsors, CROs, and study teams organize and estimate all expenses involved in a trial. This ensures accurate forecasting, efficient resource allocation, and streamlined financial management throughout the study lifecycle.
A comprehensive clinical trials budget typically includes direct costs, indirect costs, and contingency expenses. Direct costs cover patient recruitment, site management, investigation product supply, laboratory tests, monitoring, and data management. Indirect costs may include administrative overheads, regulatory submissions, and insurance. Contingency allocations allow flexibility for unexpected costs.
Dowload here Clinical Trials Budget Template
Clinical Trial Costs Per Patient
Clinical trial costs per patient vary depending on the phase, therapeutic area, and complexity of the study. Early-phase trials, such as Phase I and II, often have higher per-patient costs due to intensive monitoring, specialized procedures, and smaller patient cohorts. Phase III trials, while more expensive overall, tend to have lower per-patient costs as expenses are distributed across larger populations.which highlights the importance of understanding clinical trial costs by phase.
Careful budgeting and phase-specific planning can help optimize resource allocation and improve overall trial efficiency.
Difference in Clinical Trial Costs Per Patient by Phase:
Phase I: Highest per-patient cost due to safety monitoring, detailed pharmacokinetic studies, and small cohorts. Costs can range from $10,000 to $50,000 per patient.
Phase II: Moderate per-patient cost as efficacy is evaluated in a slightly larger population. Typical costs range from $15,000 to $40,000 per patient.
Phase III: Lower per-patient cost relative to early phases, but overall trial expenses are highest due to large sample sizes. Costs range from $5,000 to $20,000 per patient, depending on the therapeutic area
Phase IV: Post-marketing studies focus on long-term safety and real-world effectiveness. Per-patient costs vary widely, generally $2,000 to $15,000 per patient.
Oncology and rare disease trials often exceed these ranges due to complex protocols and high-cost interventions. Understanding these differences helps sponsors plan budgets and allocate resources efficiently.
How Do Contract Research Organizations (CROs) Price Their Services?
Contract Research Organizations (CROs) typically price their services based on the scope, complexity, and duration of a clinical trial. Key cost drivers include therapeutic area, number of study sites, patient recruitment targets, regulatory requirements, and specialized procedures or technologies involved. Phase-by-Phase Clinical Trial Costs are often considered when structuring these agreements to anticipate expenses at each stage of development. Pricing models may range from fixed-fee structures and unit-based costing to full-service contracts, with additional charges for monitoring visits, data management, and regulatory submissions. Sponsors often negotiate these fees, comparing proposals across CROs to ensure transparency, cost efficiency, and alignment with trial objectives.
Common CRO Pricing Models
- Fixed-Fee – One set price; best for small, well-defined studies.
- Unit-Based – Pay per activity (per patient, visit, or test).
- FTE-Based – Billed by staff time; suited for ongoing projects.
- Milestone-Based – Payments tied to trial progress.
- Hybrid – Combines models; ideal for complex or global trials.
Recommendations for Sponsors
- Fixed-fee = predictability.
- Unit-based = flexibility.
- FTE = dedicated resources.
- Milestone-based = aligns payments with progress.
- Hybrid = best for large or adaptive trials.
What is the Average Cost of Starting a Clinical Trial Site?
Starting a clinical trial site can cost anywhere from $20,000 to $75,000 or more, depending on the therapeutic area, study complexity, and location. These startup costs typically include site selection and feasibility assessments, regulatory and ethics committee submissions, staff training, infrastructure setup, contract negotiations, and patient recruitment preparations. Oncology and rare disease trials often fall on the higher end due to specialized equipment and extended timelines, while simpler Phase I/II studies may require lower upfront investments. Sponsors must carefully budget for these expenses to ensure smooth trial initiation and timely patient enrollment, while also considering Phase-by-Phase Clinical Trial Costs for long-term financial planning.
Closing Thoughts
Grasping clinical trial costs by phase helps sponsors plan budgets accurately, allocate resources wisely, and mitigate financial risks throughout the drug development lifecycle. From early-phase safety assessments to large-scale Phase III efficacy studies, costs vary considerably based on therapeutic area, patient population, and CRO services. Applying detailed cost analyses, country-specific insights, and strategic CRO partnerships enables sponsors to optimize trial execution, improve forecasting, and ensure successful, timely completion of clinical studies.

Key Takeaways
How much does a phase 1 clinical trial cost?
The phase 1 clinical trial cost typically ranges between $1 million to $5 million, depending on study complexity, patient enrollment, and therapeutic area.
How much does a phase 2 clinical trial cost?
The phase 2 clinical trial cost generally ranges from $7 million to $20 million, depending on the number of patients, study duration, and complexity of endpoints.
How much does a phase 3 clinical trial cost?
The phase 3 clinical trial cost typically ranges from $20 million to $100 million or more, depending on patient size, study duration, and therapeutic complexity.
How much does a clinical trial cost per patient?
The clinical trial cost per patient typically ranges from $10,000 to $50,000, depending on the trial phase, therapeutic area, and complexity of procedures.
How much do clinical trials cost?
The clinical trial cost can range from $1 million for early-phase trials to over $100 million for large Phase 3 studies, depending on the phase, patient population, and study complexity.
References
- ASPE/HHS (2014). Examination of Clinical Trial Costs and Barriers to Drug Development.
- JAMA Intern Med. (2018). Estimated Research and Development Investment Needed to Bring a New Medicine to Market.
- BMJ Open (2020). Cost Analysis of Clinical Trials by Phase.
- NIH ExPORTER Dataset, California Regenerative Medicine Institute Trial Data (2019).
